
| The CORA dataset (Coriolis Ocean Dataset for Reanalysis) aims to diffuse all types of in-situ temperature and salinity measurements with a maximal sampling, including high frequency profilers (ARGO, CTD, etc...) surface and sub-surface timeseries (Thermosalinographs and surface drifters, etc...). The current version of the CORA dataset (CORA5.0) stands out from the previous version by the intake of millions profiles from the historical period (1950-1990) and the intake of year 2015 profiles from Coriolis. A very careful validation process is performed on the CORA measurements since the probably erroneous profiles are individually checked by an oceanographer which changes the data quality flags if necessary. This work flow reduces the amount of unnecessary flags leading to a better estimation of the ocean variability. Last, a correction is applied on the XBT measurement depth following the method bu Hamon et al. 2012. The CORA dataset is distributed by the Copernicus Marine and Environement Service online catalogue: Product User Manual and Documentation are also distributed by Copernicus. |
 Ifremer Ifremer |
Corresponding author : Tanguy SZEKELY, tanguy.szekely@ifremer.fr
T.Szekely(1), J. Gourrion (1),, K. von Schukmann (6), C.Coatanoan (4), S. Guinehut (5), C.Boone (5), T. Carval (4), G. Reverdin (2), and S. Pouliquen (3)
(1) : IUEM, UMS3113, CNRS-UBO-IRD, Plouzané France
(2) : LOCEAN - CNRS, Paris France
(3) : LOS IFREMER, Plouzané France
(4) : SISMER IFREMER, Plouzané France
(5) : CLS - Space Oceanography Division, Ramonville St Agne, France
(6) : MERCATOR OCEAN, Ramonville St Agne, France
The Coriolis Ocean dataset for Reanalysis (CORA) dataset is a dataset of delayed time mode validated temperature and salinity in-situ measurements provided by the Coriolis datacenter and distributed by the Copernicus Marine service. The aim of the CORA dataset is to provide the higher quality measurements at a global scale for numericeal modeling, data assimilation and scientific studies. As a consequence, the CORA measurements are carefully validated by the Coriolis scientific team trought a comprehensive validation procedure including a visual confirmation of the doubtful profiles. The lates release of the CORA dataste (namely CORA 5.0) covers the period 1950 – 2015.
Motivations
An ideal set of in situ oceanographic data should cover the entire global ocean and be continuous in time, subject to regular quality control and calibration procedures, and encompass several spatial and temporal scales. This goal is not an easy one to achieve in reality, especially with in situ oceanographic profiles because they have basically many origins as there are various scientific campaigns to collect them.
Efforts to produce such ideal global dataset have been done for many years, especially since Levitus (1982). The most comprehensive and widely used today is the World Ocean Database produced by the National Oceanographic Data Centre (NODC) Ocean Climate Laboratory (OCL), whose latest version WOD13 contains historical and modern temperature, salinity and plankton data from the 19th century to 2013. More recently, the MetOffice Hadley Centre produced and maintained a quality-controlled subsurface ocean and salinity dataset (Ingleby and Huddleston, 2007, Good et al. 2013), whose last version EN4 spans the period from 1900 until the present.
Launched at the beginning of the 2000’s, the French operational oceanographic programme CORIOLIS aimed at providing ocean in situ measurements to the French operational ocean analysis and forecasting system (Mercator Ocean) and to contribute to a continuous, automatic and permanent observation networks (Coatanoan and Petit de la Villeon, 2005). The CORIOLIS Data Centre (DAC) has been set up to gather, qualify and distribute data from the global ocean both in real and delayed time.
Since 2010, The DAC and the R&D Coriolis team worked together to produce a yearly update of a quality-controlled dataset with all the data acquired by the Coriolis DAC during the last year. This demand is a necessity for reanalysis projects (such as GLORYS, see Ferry et al., 2010) including validation, initialization and assimilation of models (Lellouche et al., 2012) and those of general oceanographic research studies including ones on climate change (von Schukmann and Le Traon, 2011 ; Souza et al., 2011 ; Guinehut et al., 2012).
Data and Methodology
Every day, the Coriolis data centre collects temperature and salinity measurements from french projects (SO ARGO, SO PIRATA, SO SSS,...), as well as european parteners (SeaDataNet, EuroGOOS, MyOcean and COPERNICUS) and international projects (ARGO, WOD13, GOSUD, OceanSITES, GTSPP, iCES ,etc...). While the CORIOLIS database (http://www.coriolis.eu.org/cdc/data_selection.htm) is updated every day as new data arrive, the CORA database corresponds to an extraction of all in situ T/S profiles and timeseries from the CORIOLIS database at a given time. In this context, measurements covering the periode from 1950 to 2015 have been extracted from the Coriolis database on june 2016. In addition to that, over 3 million profiles have been extracted from the global delayed time mode dataset EN4 thanks to a cooperation with the British MetOffice (www.metoffice.gov).

Figure 1 :Yearly number of CORA profiles for various instruments types (lower curves), EN4 profiles (upper curves).
Figure 1 gives an estimation of the number of profiles distributed in CORA5.0 as a function of time. We can sea the development of oceanographic instruments trought the XXth century. The very first instruments in the 1950s are the mechanical bathythermographs (MBTs) and the bottle samples. The expendables bathythermographs have been widely used from the late 70s to the early 90s trought military programs. The modern CTDs have alse been developped in the late 70s, but it was a less popular instrument. The tropical moorings (TAO/RAMA/PIRATA/TRITON/ deployed during the 1990s decade gives a large number of measurements. Last, the modern ARGO floats gives numerous measurements in the 2000s decade, leading to a global coverage of the oceanographic measurements. The shaded curves show that most on the EN4 intake takes place before 1990 and are copmposed of MBTs and bottles measurements. A second large intake is composed of towed CTDs (scanfish and seasoars) and sea mammals measurements during year 2005-2010.
Data received by the Coriolis data centre from different sources are put through a set of real or near-real time quality control procedures (Coatanoan and Petit de la Villeon, 2005) to ensure a consistent dataset. Each measurement for each profile is associated with a control quality flag, ranging from 0 to with flag 1 for good data and flag 4 for bad data. Beside those basic tests, several other quality checks have been developed to produce CORA5.0, in order to reach the quality level required by the physical ocean reanalysis activities. At the DAC, more systematic tests are performed in real or near-real time. A statistical test based on objective analysis method (Gaillard et al., 2009), a visual quality check run on data managed by the Coriolis centre or an altimetric test operated on ARGO data (Guinehut et al.2009) led to improve the quality of the CORA dataset.
The data go then through delayed-time validation procedures. Only the data considered as good or probably good (flag 1 or 2) after real and near-real time tests or those which have never been checked (flag 0) are further verified in delayed mode. Comparisons with climatology (the anomaly method), and tests designed for Argo floats are applied before a model background check based on global ocean reanalysis GLORYS2V1 (Ferry et al., 2010). Each time a profile fails a test, it is checked visually and control quality flags of each measurement at each level are examined and changed if necessary. The visual quality check is a very important step in the quality control procedure of the CORA dataset since it allows the rejection of observations that have passed the other tests, or allows the requalification of rejected observations as good measurements.
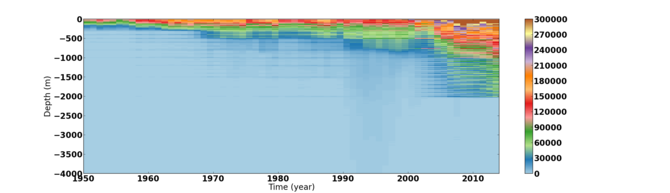
Figure 2 :Yearly number CORA5.0 temperature measurementper year in 20 meter depth bins
The CORA5.0 dataset not only contains the raw parameters such as temperature, salinity, pressure or depth, as received from the instrument, it can also include adjusted parameters, i.e. temperature, salinity, pressure or depth corrected from a drift or offset. The data types affected by these adjustments are Argo floats and XBTs. For Argo data, it is the responsibility of each DAC to provide data corrections both in real time and delayed mode. The Coriolis data centre, as a GDAC, gathers these corrections and stores raw and adjusted parameters in the Coriolis database.
A correction on XBT measurements in the CORA 5.0 dataset. The corrected temperature and depth fields are writen in an adjusted field apart from the original one, so one can still use the original TEMP and DEPTH measurement and apply his own correction. This XBT correction method is based on the work by Hamon et al. 2012. This method first applies a correction on the mean temperature offset in the upper layer, between XBT measurements and CTD measurements. Then, it applies a correction based on the computation of the quadratic regression of the mean depth error between XBTs and a local mean temperature measured by CTDs. The XBT measurements are separated into 2 categories: the shallow XBTs, with a maximal depth lower than 500 m, and the deep XBTs with a maximal depth lower than 500 m. These two groups are then divided into 2 sub-categories, the "Warm" XBT's, for which mean temperature between 0 and 200 m is higher than 8°C , and the "Cold" XBTs for which this temperature is lower than 12°C, the two categories overlapping for lowering the gap between the two corrections.
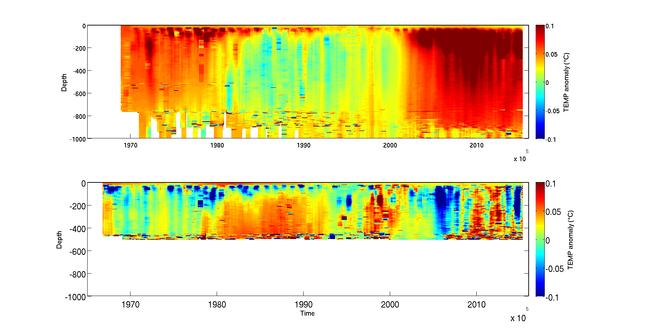
Figure 3 :Anomaly of XBT measurements mismatch with reference CTDs for deep XBTs (top) and shallow XBTs (bot.).
Fig.3 gives the amplitude of the anomaly between the XBT-CTD mismatch before and after the correction.Positive fields are cases were the mismatche has decreased in the adjusted field. It shows that the XBT correction is very efficient before 1980 and after 2000 for the deep XBT case and between 1980 and 2000 for the shallow case.. The noise observed at the top and the bottom of the water column is influenced by the higher temperature variability at the surface and the lower number of matchpoints below 800m for the deep case and below 450m for the shallow case. Ths diference in the deep and shallow XBTs correction is a consequence of a difference in space-timerepartition of the XBT types.
Uses of the CORA dataset
Oceanic parameters form in situ T/S profiles can be useful for analysing the physical state of the global ocean and have a large range of vital applications in the multidisciplinary fields of climate research studies. Several GSSL (Global Steric Sea Level) estimations based on Argo and/or other in situ observations have been derived over the past couple of years (Willis et al., 2008 ; Cazenave and Llovel, 2010; von Schukmann and Le Traon, 2011). But these global statistic analyses are not consistent mainly because of differences in estimation periods, instrumental biases, quality control and processing issues, the role of the salinity and the influence of the reference depth for GSSL calculations.

Figure 4 : Estimation of GSSL for the year 2005–2010 with a 1500 m reference depth. The calculation is based on a simple box aver- aging method described in von Scuckmann and Le Traon (2011) (VST2011). Results obtained with CORA3 (red and green curves) are compared to those obtained by VST2011. The 6-yr trends obtained are 0.64 ± 0.12 mm yr−1 with CORA3 (0.58 ± 0.10 mm yr−1 for CORA3 with only Argo data) and 0.69±0.14mmyr−1 for VST2011. Error bars (red areas) are shown for CORA3 (all data) and are calculated as described in VST2011.This total error includes the uncertainties on the averaged parameter in every 5◦ × 10◦ × 3- month box and the choice of the reference climatology, but it does not take into account possible unknown systematic measurement errors (Cabanes et al., 2013)
Results obtained with the previous CORA3 dataset on GSSL estimations have been compared with GSSL estimated from von Schukmann and Le Traon (2011) (fig.3) based on Argo data only. Using the CORA3 dataset, the 6-year GSSL trend is 0.64+/- 0.12 mm.yr-1 and lies within the error bars of the von Schukmann and Le Traon (2011) estimates. This quite good agreement may be due to the fact that the method of GSSL computation is not very sensitive to any bad data that possibly remains in the dataset or that some residual positive and negative biases in in situ data compensate each other. More sensitivity studies are therefore needed to estimate GSSL from the CORA3 dataset.
CORA can be used also to construct climatologies of heat content, depth of the thermocline or climate indices which are very useful for validating ocean model outputs and improve their quality or assess their results. For example, de Boyer Montégut et al., 2007 validate their OGCM mixed layer depth outputs against in situ observations in the northern Indian Ocean.
An objective analysis of the CORA5.0 dataset is also distributed by the Copernicus Marine and Environment Service. This monthly gridded field of temperature and salinity covers the period 1990 to 2015 with 152 vertical levels from surface to 2000 meter depth. Figure 5 gives the Global Ocean Heat Content (GOHC) anomaly calculated thanks to the CORA OA fields compared to the GOHC estimated by Von Schuckmann and Le Traon, 2014. The fairy good agreement between the two curves trends is a goof feature of the CORA products.
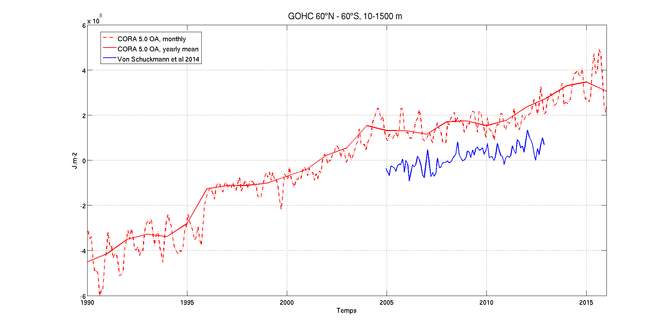
Figure 5 : Global Ocean Heat Content calculated from -60 °N to 60°N and from surface to -1500 m depth calculated y Von Schuchmann et al and CORA OA.
Finally, an important application of the CORA database is its use in ocean reanalysis. In France, global ocean reanalysis activity is a joint collaboration between Mercator-Océan, Coriolis Data Centre and several oceanographic and atmospheric research laboratories in the framewrok of GLORYS project (Ferry et al., 2010).
References
- Boyer, T. P., Antonov, J. I., Baranova, O. K., Garcia, H. E., Johnson, D. R., Locarnini, R. A., Mishonov, A. V., O’Brien, T. D., Seidov, D., Smolyar, I. V., and Zweng, M. M., 2009 : World Ocean Database 2009, edited by: Levitus, S., NOAA Atlas NESDIS 66, US Gov. Printing Office, Wash., DC, 216 pp., DVDs.
- Cabanes, C., A. Grouazel, K. von Schuckmann, M. Hamon, V. Turpin, C. Coatanoan, F. Paris, S. Guinehut, C. Boone, N. Ferry, C. de Boyer Montégut, T. Carval, G. Reverdin, S. Pouliquen, and P. Y. Le Traon, 2013: The CORA dataset: validation and diagnostics of in-situ ocean temperature and salinity measurements. Ocean Science, 9, 1-18, http://www.ocean-sci.net/9/1/2013/
- Cazenave, A. and Llovel, W., 2010 : Contemporary Sea Level Rise, Annual Review of Marine Science, 2, 145–173, doi:10.1146/annurev- marine-120308-081105.
- Coatanoan, C. and Petit de la Villeon, L.: Coriolis Data Centre, In-situ data quality control procedures, Ifremer report, 17 pp., available at: http://www.coriolis.eu.org/content/download/4918/36060/file/cordo-rap-04-047-quality- control.pdf (last access: February 2012), 2005.
- Delcroix, T. and co-authors (2005). Time and space scales for sea surface salinity in the tropical ocean. Deep-sea Research, 52, 787-813.
- Ferry, N., Parent, L., Garric, G., Barnier, B., Jourdain, N. C., and the Mercator Ocean team, 2010 : Mercator global eddy permitting ocean reanalysis GLORYS1V1: Description and results, Mercator Quarterly Newsletter 36, available at: http://www.mercator-ocean.fr/fre/actualites-agenda/newsletter/newsletter-Newsletter-36-Data-assimilation-and-its-application-to-Ocean-Reanalyses, (last access: January 2013), January 2010.
- Good, S. A., Martin, J. and Rayner, N. A., 2013. EN4 : quality controled ocean temperature and salinity profiles and monthly objective analyses with uncertanity estimates. Journal of Geophysical Research : Oceans, 118, 6704-6716.
- Guinehut, S., Coatanoan, C., Dhomps, A.-L., Le Traon, P.-Y., and Larnicol, G., 2009 : On the Use of Satellite Altimeter Data in Argo Quality Control, J. Atmos. Ocean. Tech., 26, 395–402.
- Hamon, M., Reverdin, G. and Le Traon, P.-Y.: Empirical correction of XBT data, J. Atmos. Ocean. Tech., 29, 960–973, doi:10.1175/JTECH-D-11-00129.1, 2012.
- Ingleby, B. and Huddleston, M., 2007 : Quality control of ocean temperature and salinity profiles - historical and real-time data, J. Marine Syst., 65, 158–175, doi:10.1016/j.jmarsys.2005.11.019.
- Lellouche, J.-M.,LeGalloudec,O.,Dre ́villon,M.,Re ́gnier,C., Greiner, E., Garric, G., Ferry, N., Desportes, C., Testut, C.-E., Bricaud, C., Bourdalle ́-Badie, R., Tranchant, B., Benkiran, M., Drillet, Y., Daudin, A., and De Nicola, C., 2012 : Evaluation of real time and future global monitoring and forecasting systems at Merca- tor Oce ́an, Ocean Sci. Discuss., 9, 1123–1185, doi:10.5194/osd- 9-1123-2012.
- Levitus, S., 1982 : Climatological Atlas of the World Ocean, NOAA Professional Paper 13, US Government Printing Office, Rockville, MD, 190 pp.
- Levitus, S., Antonov, J., Boyer, T., Locamini, R. A., Garcia, H. E., and Mishonov, A. V., 2009 : Global ocean heat content 1955–2008 in light of recently revealed instrumentation problems, Geophys. Res. Lett., 36, L07608, doi:10.1029/2008GL037155.
- Roquet, F. and co-authors (2014) A southern Indian databaseof hydrographic profiles obtained with instrumented elephant seals. Nature Scientific Data, 1:140028
- Roquet, F. and co-authors (2013) Estimates of the Southern Ocean general circulation improved by animal-borne instruments. Geophysical research letters, 40:1-5.
- Roquet, F. & co-authors (2013) Estimates of the Southern Ocean general circulation improved by animal-borne instruments. Geophysical research letters, 40: 1-5.
- von Schuckmann, K. and Le Traon, P.-Y., 2011 : How well can we derive Global Ocean Indicators from Argo data?, Ocean Sci., 7, 783– 791, doi:10.5194/os-7-783-2011.
- von Schuckmann, K. and Salé, J.-B. and Chambers, B. and Le Traon, P.-Y. and Cabanes, C. and Gaillard, F. and Speich, S. and Hamon, H., 2014 : Concistency of the current global ocean observing system from an Argo perspective , Ocean Sci.,10, 547– 557, 2014.
- Willis, J. K., Chambers, D. P., and Nerem, R. S., 2008 : Assessing the globally averaged sea level budget on seasonal to interannual timescales, J. Geophys. Res., 113, C06015, doi:10.1029/2007JC004517.