
Copernicus Marine In Situ data discovery
- Hit maps from the index files
- Key performance indicators (KPIs)
- The last 30 days for European regions: http://www.ifremer.fr/co-googleEarth/
- Oceanotron
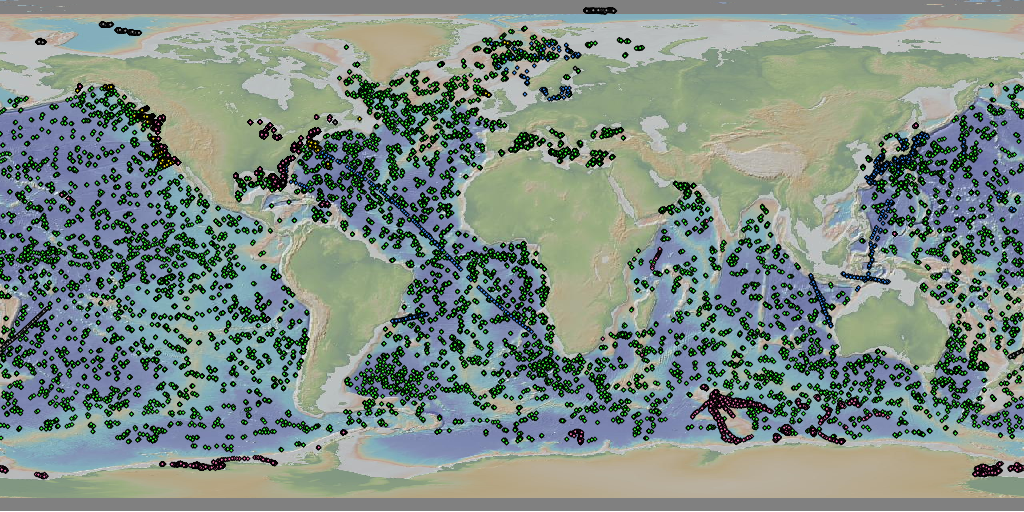
View Maps of the latest 30 days of in situ data
1)- Profile data
Profile data are aquired by various platforms:
- Argo floats when they are profiling from their maximum depth to the surface every 10 days namely
- XBT lauched from research or voluntary observing vessels
- CDT transmitted in real-timeby scientist from research cruises or in delayed mode by National Oceanograpic centers
- Gliders when they are profiling from their maximum depth to the surface or from surface to depth
- Moorings
- sea mammals equipped with Argos antenna
These data are available at the Coriolis data center through the Data selection interface >> click here to see the latest map
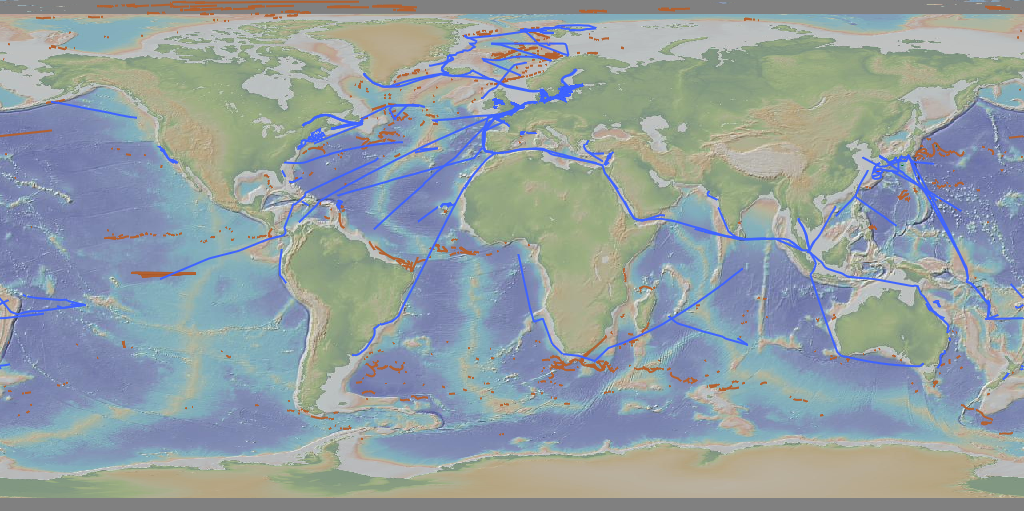
2) - Underway data
Underway data are aquired by various platforms :
- Argo floats when they are drifting at their parking depth or at the surface
- Surface drifters
- Research and Voluntary Observing Vessels
These data are available at the Coriolis data center through the Data selection interface >> click here to see the latest map
3)- ARGO data
Latest 30 days data from Argo Network >> click here to see the latest map
4) - GOSUD data
About XX vessels transmit thermosalinograph data in real-time. This map shows the latest 30 days of data acquired by this network and available from the Coriolis Argo GDAC ( Global DAta Center) >> click here to see the latest map
5) - OceanSITES data
This map shows the latest 30 days of data acquired by the OceanSITES network , complemented by fixed station provided by EuroGOOS members within MyOcean projects. They are available from the Coriolis Argo GDAC ( Global DAta Center) and MyOcean in situ TAc
>> click here to see Latest 30 days data from OceanSITES Network and European mooring Sites
6) - DBCP data
Click here to see the map of the latest 30 days of data acquired by the drifter from DBCP network and available from the Coriolis Argo GDAC (Global DAta Center).
7) - EGO data
Click here to see the map of the latest 30 days of data acquired by the Everyone's Gliding Observatories (EGO) initiative and available from the Coriolis Argo GDAC (Global DAta Center)
8) - Ireland Biscay Iberia Seas
Each day, Coriolis data center collects on global networks ( GTS , ARGO/GOSUD/OceanSITES GDACS) as well as Irland Biscay Iberia Seas centers (IMI, Puertos Del Estado, IOE, HI,...) ,..) temperature and salinity data. It quality controls them and makes them available on a daily basis to the operational and research community. Other parameters are collected within MyOcean projects and be available through Coriolis, MyOcean and IBI-ROOS portals.
>> Click here to see the data available within past 30 days for Ireland Biscay Iberia seas
View gridded T/S maps
- The documentation is available here
- To download the data, connect here to the ftp with your MyOcean login and password. If you do not have MyOcean login, follow this link.
Use WMS map services
A Web Map Service (OGC-WMS) is a standard protocol for serving georeferenced map images over the Internet. The maps are generated from in-situ observations (Coriolis, Argo, MyOcean…). The WMS services are usefull for web sites (such as portals) willing to display maps from various suppliers.
>> Example : a direct call of this WMS service from Sextant data portal